GIS + EAM: Turning As-Built Edits into Asset Strategy
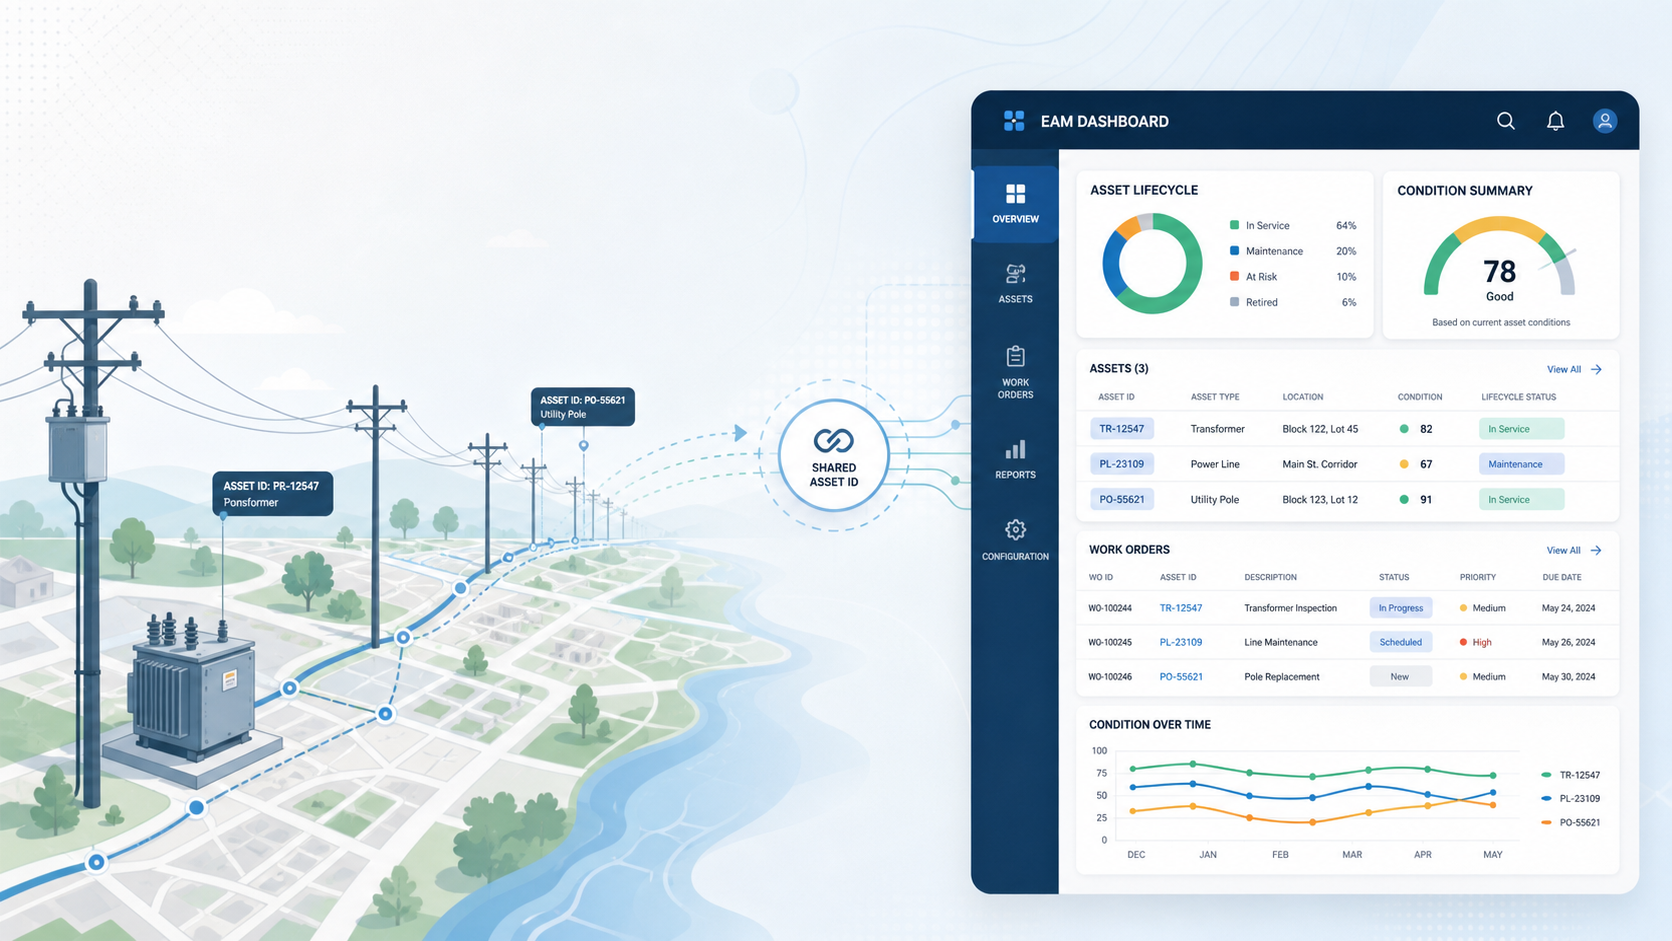
GIS + EAM: Turning As-Built Edits into Asset Strategy The GIS–EAM integration gap Many utilities have both GIS and EAM, but they still behave like neighboring countries: one for maps, one for work. GIS usually knows where the asset is, how it is connected, and what the network looks like. EAM usually knows what the asset is in lifecycle terms, what work has been done to it, and what is supposed to happen next. On paper, that is complementary. In practice, the two systems are often tied together by partial syncs, manual re-entry, and workflows that depend more on tribal knowledge than design. ...